Tracking WAN Uptime to My ASUS/Merlin Router – Intro
In a previous post I described a system that I built to keep track of LAN outages within my home. What is missing is a method for tracking WAN outages to my home. This post describes the system that I put into place to track the WAN outages.
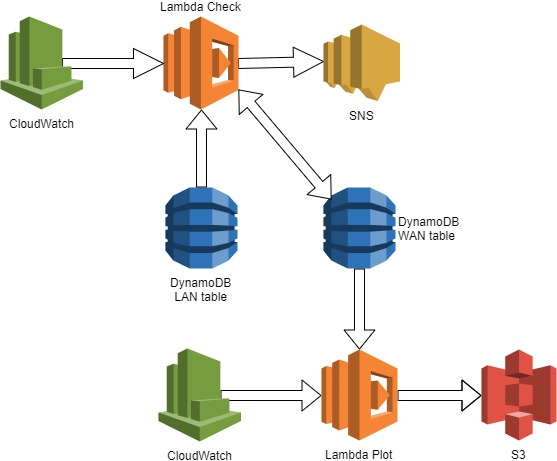
In keeping with the LAN system I first planned on using ping from AWS, then I remembered that Lambda does not allow that kind of traffic, in fact it allows almost no traffic. I really don’t want to spin up a server for this. But I need some way to see if traffic can be sent and received from my house. I can check and see if the traffic from my house can reach AWS. Hey, I already receive traffic from my house on a regular basis that is stored in AWS; the LAN outage system. I can piggyback on that. The LAN outage system runs every 5 minutes on the 5th minute. I can have a CloudWatch rule that runs every 5 minutes on the 2nd minute and checks to make sure that a LAN status was stored in the last 5 minutes. The architecture looks like this.

A CloudWatch rule executes the Lambda check function every 5 minutes on the 2nd minute. The function checks the LAN table and determines uptime as up if a record was inserted within the last 5 minutes. It then reads the WAN table and determines if the uptime value has changed since it was last checked. If it has changed a message is published to an SNS topic which I receive as a text message on my cell phone. Lastly, the WAN status is saved in the WAN DynamoDB WAN table.
Once a day, another Cloudwatch rule executes the Lambda plot function which reads the WAN DynamoDB table, creates a plot of the uptime statuses and saves the plot on S3.
I coded this up and everything seemed to be working just fine, and then one day I receive a spike on the WAN plot that did not have a matching spike on the LAN plot. According to my architecture the only way I could get an outage in WAN is if there is a record missing in the LAN status. A record missing in the LAN status will generate a spike in the LAN outage. So, I might be facing a bug and I looked into what happened. In both the LAN and WAN table, there were no records missing. Maybe I am gathering them incorrectly when plotting as I calculate which 5 minute index a record belongs in and I overwrite the result. So if there was a delay in processing I would not see a spike down (no record) followed by a spike up (two records). That is not bullet proof code. But fixing that doesn’t really fix the problem. Fortunately, CloudWatch logs and metrics were very helpful.

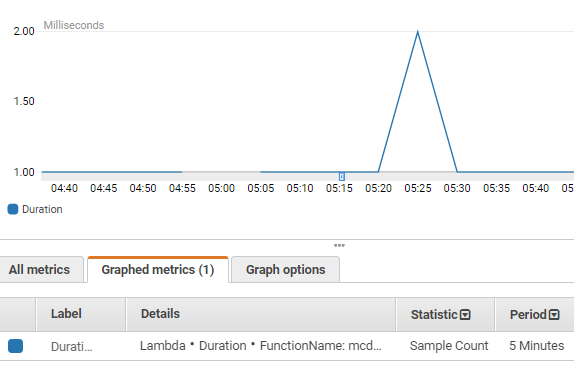
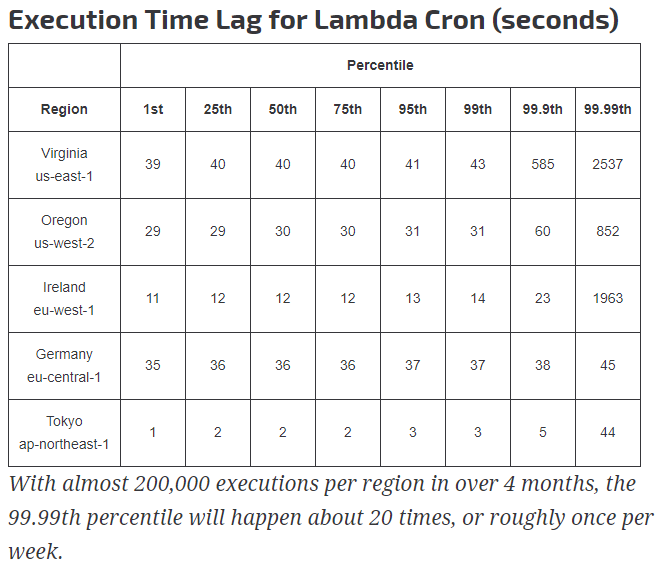
It is easy to see here that there were no executions around 5 AM and two executions a little later at 5:25AM. When I looked at the CreateTS attribute in the WAN table, the issue became apparent. CloudWatch is indeed calls Lambda the correct number of times. And while CloudWatch does warn that an event might suffer a delay, I never anticipated a delay that might be more than 5 minutes long. Frankly, I am amazed. In all of the time I’ve played with AWS and the 4 certifications I have taken, this is the first time I can say that something is broken and needs to be fixed. I Googled this issue and found that Andy Warzon of Trek10 had managed to compile some great statistics around this possible delay between a CloudWatch scheduled event and when the triggered Lambda function is started.
As you can see, 99 out of 100 executions the delay is a consistent number of seconds, but the 1 time out of 100 can be 2 times as long to 60 times as long. For the us-east-1, that is up to 42 minutes later. Brutal. So, temporarily I fixed this by comparing the duration between WAN status. If the duration between status is > 6 minutes, then the lag is bad and set the CreateTS to the previous CreateTS + 5 minutes. Not the best fix, but it will result in the plot not showing false outages. I need to come up with a more reliable serverless Cron system.
The rest of the functionality is provided in separate posts about a lambda function that checks for LAN data and a lambda function that creates the plot.
